If I could nominate my favourite teaching tool-that-is-not-a-tool of late, it would be ramps. As of this week (written in Week 5, Term 4 2021) I have planned and executed lessons around ramps for Stage 4 Ratios and Rates, Stage 5 Trigonometry and Stage 5 Linear Relationships. Although the premise is very similar for each of these ramps lessons (how brilliant are right-angled triangles?), I will add some detail about how they developed over time.
The initial lesson
Ramps 1.0 started out as a trigonometry lesson for year 9 on my prac last year. I wanted material that was contextual and realistic – beyond the typical ladder against the wall-type problems. As usual, I went looking in Don Steward’s Median blog, where I came across his post on the steepness of wheelchair ramps.
Looking around the school, I saw ramps of different gradients, and that prompted me to consider whether a comparative task could be created.
I referred to the Design for Dignity website, which features the requirements for the height and length of ramps for Australia. These are expressed as ratios.
Considering that trigonometry is all about ratios, I asked them to first calculate the angle of incline for each of these types of ramps. Then they could figure out the range of angles that would identify ramps as kerb, step or threshold. I gave school ramp measurements to the students and asked them to find the angle of incline for each one, and asked them to check which ones were wheelchair accessible.
The students really enjoyed the context, as they saw their school in a different light – the ordinary ramps all of a sudden became visual cues for inclusivity, access and design. They were invested in finding out which ramps were indeed wheelchair-friendly, and what this meant for those trying to access parts of the school if some ramps were too steep. It was an early success!
Two new ramps lessons
This year on my internship I was teaching Stage 5 Linear Relationships and Stage 4 Ratios and Rates. Year 10 were getting quite sick of coordinate geometry after midpoint and distance between two points, so I had to introduce gradient in a different way. A non-teaching friend gave the interesting suggestion of getting students to plank on the ground and raise their bodies to create different gradients (which could have been a hit as well). Somehow that reminded me of investigating ramps, so I looked back at the lesson from last year and thought about how I could make it relevant to linear relationships.
Different ramps around the school
I went around the school and took pictures of different ramps. I was fairly certain that they were wheelchair friendly, but I wanted the students to check for me. This time, I got them outside and measuring the ‘rise’ and the ‘run’ of the ramps with tape measures and trundle wheels.
A couple of things I learnt to get students to do before they leave the room, which may seem obvious to everyone else:
Get students to label the rise and run of the ramps on the images on their worksheet before they go outside and measure the wrong part
Get students to measure things in the classroom first before they ‘graduate’ to the outdoor arena
List expectations for behaviour outside the classroom, and have students repeat them back to me
The worksheet was quite straightforward, just a table with images of the ramps for reference and parts to fill in. I also had a part where students had to rank the ramps from steepest to gentlest, and describe their process for doing so.
A part of the Stage 5 worksheetOrdering the ramps, explaining the process
Coincidentally, Year 8s were studying ratios and rates, so I simply reused the same practical lesson with the class. All I really did was modify the table so that students were writing the rise and run of the ramps in ratio form, i.e. rise : run. The wording of Question 4 above was similar, except I swapped the word ‘gradient’ for ‘ratios’. I also asked students to use the Design for Dignity definitions of kerb, step and threshold ramps to help them label each type of ramp.
In terms of the lesson, I took my learning points from Year 10 and followed them through with Year 8 – I made sure this time to lay out my expectations for their behaviour outside before we would head out as a class. I also demonstrated where to locate the rise and run of the ramps using the images, and how to use a trundle wheel.
On the Year 8 sheet, I added 2 extra questions:
Was there anything you found challenging about the task?
What would you rate this task out of 5?
Surprisingly, many students responded with 3-5, although some disliked the task. Nonetheless, I think this resource is well worth having in my repertoire, particularly at the end of the day/week. It’s also deeply contextual and I would say makes authentic links to students’ physical world. Hope this will inspire you!
Hello and welcome to another edition of Belated Blog Posts. Here is Part 2 of my MANSW Conference recap. Part 1 can be found here, and it was written while things were still fresh. The rest of this post is possibly quite stale.
Session 3
The third session I attended was ‘The problem with word problems is the words: Connecting numeracy and literacy’ by Karen McDaid. Karen referred to Polya’s steps to problem solving as the main framework:
Understand the problem
Decide on a plan to solve the problem
Carry out the plan – talk and test it out
Look back and check – does the answer fit into the question?
Step 1 happens to be the most important step – the question needs to be broken down by students and interpreted properly before they can create a plan. It’s a good idea for students to express how they perceive the problem to demonstrate their understanding. Oftentimes questions are not as visual as they need to be, so get students to draw out the scenario to assist with their interpretation.
We also covered a couple of hands-on activities, and I’ll briefly mention the ones I noted down.
We played around with the Frog Slide/Jump activity with counters and a template, which ties into the patterns topic. The digital version of this activity can be found here (thanks NRICH!).
We also investigated a probability scenario, which goes like this:
Two players are trying to win a game. There are two boxes in front of them. In Box 1, there are three red balls and one blue ball. In Box 2, there are two red balls and two blue balls. Both players have to select a ball from each box.
Player A wins if they select two balls of the same colour, while Player B wins if they select two balls of different colours. Who is more likely to win?
For each of these activities we were encouraged to visually map out our thinking. Here’s what I had for the probability activity:
As Karen moved around the room she was able to verbally give us feedback on our solutions because she could clearly see what we were doing and identify our thinking. In my own lessons, I know that ensuring students are mapping out their ideas can help me see what they would need support with, especially in interpreting word-heavy problems.
And as you can also see in the image, I wrote down the name of a resource that offers multiple literacy-focused templates for mathematics teachers. They are called Think Board templates and can be found here.
Overall, there were some really useful insights and resources to take away from the session.
Session 4
For the final session, I chose to attend Peter Sullivan’s workshop, ‘Structuring mathematics lessons to include all students’. A few elements from his keynote address found their way in again, and they were a great way to reinforce some of the effective practices he had spoken about in the morning.
His presentation promoted a number of strategies that I had come across before in a publication he wrote for ACER, linked here. If you have the time, go through it as it is very thorough and practical, and my recap below will go through some of the activities that occurred during this presentation which show off the concepts in the document.
Peter outlined six key strategies, which I’ll summarise here with reference to activities he got us to participate in.
Strategy 1: Inclusive fluency experiences
As we know, fluency is one of the Working Mathematically indicators, and often, it seems to be the primary one being promoted in textbooks and worksheet questions. While it is important for students to have mathematical fluency, it is only a stepping stone towards richer mathematical experiences.
An activity that can support whole class fluency is class chanting/choral response. Peter created a few versions for us, but as I didn’t write them down so I’m basing this off memory. You could set up some PowerPoint slides, where each slide has a different number written on it. As you switch between the slides you could ask the class to say the number as soon as they see it, or preferably give a more complex prompt. For instance: when you see the number, subtract 10 and say the answer; when you see the number, add 5 and say the answer.
This would make an ideal warm-up activity for the lesson, so students who are fluent don’t spend the whole lesson on fluency, and students who are developing their fluency have this opportunity to practice multiple calculations in a short period of time. If a student makes a mistake they won’t feel that the attention will be on them, and they can get back on track with the next one.
Strategy 2: Low floor, high ceiling
Low floor, high ceiling tasks are essentially tasks which allow any student to begin, but with endless possibilities for extension. In my first recap post, I mentioned some opening activities that Charles gave as part of his talk on open-ended investigations – these fit right in as low floor, high ceiling.
So it was no surprise that Peter had some open-ended activities prepared for us. One was an unfilled number line, with only one number indicated, so we had to fill in the rest of the number line based around that number. This meant we could choose the scale of the number line, so that there were numerous different responses to the prompt. Another activity was a hands-on sentence creation task, where we were given little word cards to arrange to make a sentence that made sense mathematically and grammatically.
Here are the word cards! Apologies for being unable to crop the image properly.
Strategy 3: Enabling and extending prompts
I won’t go into too much detail about these, as they are described really well in the ACER paper. Briefly, enabling prompts are prompts given to students to support them when they experience difficulty with a task. However, it is important for teachers not to immediately offer these until students have attempted an activity and it is clear that they are struggling with elements/complexity of the task, rather than with understanding it. Enabling prompts can involve offering a change of representation, so students can see the task in a more familiar setting, it may involve simplifying some numbers or require fewer variables or steps to the original task.
Extending prompts are used to encourage students towards more abstract thinking, and allow them to see the mathematics in more depth. We can extend tasks by changing the representation so that it is at a more abstract level, we can make the numbers more complex, or ask students ‘Have we found all the answers?’ or ‘Convince me that…’
During the session, Peter asked us to come up with enabling and extending prompts for our sentence activity.
Strategy 4: Pose consolidating tasks
Afterwards, we need to set a task that is similar to the one we offered, but a little different as well. However, we have to make sure that the concepts being reinforced are still the same. Peter got us to come up with some tasks that consolidated the same concept as in the sentence activity. We heard some really great ideas from different tables.
Strategy 5: Effective collaborative discussion
In our mathematics lessons, it is important that we find places to promote student discussion. Before a consolidating task, for example, a whole class discussion could be set up to discuss the previous activity, the concepts learnt, and strategies students applied to solve the task. Students’ thinking should be valued, and shared so classmates are able to learn from each other. This consolidates the learning and allows them to approach the consolidating task with confidence.
This was a great session. It was interactive, well-structured and made us think a lot. I cannot recommend the ACER document enough, especially the sections on structuring lessons and differentiation. Give it a read and you’ll have an idea of what Peter covered during the workshop.
Conclusion
That’s a wrap! I thoroughly enjoyed my first MANSW conference. I learnt a lot and I suspect I will be attending many more in the coming years.
Thanks for reading, stay tuned for more inconsistent updates.
Foreword: Curse my “living in the moment” attitude and my lack of pictures from the day! It’s going to be hard to illustrate everything without photo evidence, but I will do my best. And now I know for next time that a picture can save me up to a thousand words of description.
Introduction
I attended the MANSW K-8 Conference at the end of last month, and I had a really great time. It was my first professional learning conference. I absorbed a lot of new ideas, got my hands on some new resources, and connected with other maths teachers throughout the day.
This recap is a summary of the sessions I attended that day. The keynote address in the morning was given by Peter Sullivan, and the concluding address at the end of the day was presented by Charles Lovitt. I don’t think I’ll recap those as I attended both these speakers’ workshop sessions and I don’t want to give all their wisdom away!
Let’s dive in.
Session 1: The rise and rise of open-ended investigative approaches to mathematics – Charles Lovitt
I am so glad I attended this session. I have long heard great things about Charles, and I walked away knowing exactly why. He opened the session by drawing a scale/spectrum on the board – on one end, ‘Closed’, in the middle, ‘Open’, and at the far end, ‘Extended investigation’.
Under Closed, he wrote “6+5 = ?”. We answered.
Now, he goes, how about instead of asking for an answer, we ask for multiple answers. What are two numbers that add up to 11?
So we listed a few.
Then he asks, “Have you found them all?”
We gave a few more examples then called it a day.
Great! Now how about two numbers that add up to 12?
By this point he had drawn up a little table under Open, the top row with numbers 11 and up, and the bottom row with the number of pairs that would add up to their total. At our tables we worked out the pairs for a total of 12, total of 13, total of 14… Soon we noticed a pattern.
So, what if I wanted the number of pairs that add up to 80? Can you work that out?
With a little thinking, yes we could.
Under ‘Extended Investigation’ he was busily writing some new prompts. ‘What about triples that add up to 11?’ ‘What about groups of numbers of any size?’
No challenge too great, we wrote up a table for those too. But the formula for any-sized partitions were very tricky… It turns out this notion of partitioning numbers has been around for a very long time, and was an unsolvable problem for many generations. Anyway, here’s the apparent solution.
My solution looked nothing like this, I think it’s because I forgot to carry the 1.
Child’s play, right? Charles told us that it was the Indian mathematician Ramanujan who ended up solving this problem. He also told us he likes to get his students to research some facts about Ramanujan for a bit of maths history appreciation.
With extended investigations, there is always more. Getting students to think about ‘more’ than a closed problem develops not only the basic skills, but improves their mathematical reasoning and communication, while raising their interest. These tasks are also differentiated, and accommodates for a potential 7 year gap in knowledge between students – common in middle years classrooms!
We went through two more activities from the Maths300 collection.
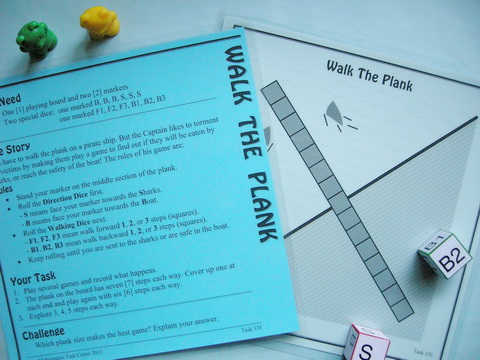
One was called Walk the Plank. All that was needed was some cones, marking out about 6 steps on either side of a middle point, and two dice. One of these dice had half the sides labelled S (for shark), and the other B (boat). The other die had sides labelled F1, F2, F3 (forward 1, 2, 3) and B1, B2, B3 (backward 1, 2, 3). A student would get up and stand in the middle of the plank. Their partner would roll the letter dice to figure out whether they would face the shark or the boat. Then, the numbered dice would determine whether they would take steps forward or backward.
The aim is not to fall into the sea of hungry sharks… And it can be played competitively between pairs too.
Here’s a worksheet version as well.
From this activity, we can see how it helps students conceptualise number lines, and working with negative integers. Facing the shark means that we have the intent of approaching the negative end of the number line, but rolling a B3, means that we have two negatives, and overall we end up moving towards the boat. Once students start to record their moves, it’s easy to prompt them to consider more symbolic representations, and eventually these would be tied to computation with negative integers.
Charles showed us other ways of extending this activity. On the Maths300 website, there is a probability/distribution chart app that allows students to play with the game design. They can figure out the perfect number of steps along the plank to determine the best amount of game time for young people. Students can make different variations of Walk the Plank as well, with a different theme and extensions that make it easier or more challenging to win.
The second activity was Game of ’22’. This is also played in pairs. Four rows of playing cards from 1 to 6 are laid out in front of the players. They take turns flipping a card, and call out the total as they go. The first player to flip that card that takes them to a total of 22 wins.
I really like this activity because there is a trick to winning the game. And it can open up lots of discussion between students as they try to figure out whether there is a quick way to win. Once they know, they can win at any game, whether the total is 23 or 52 or 619. It’s an activity that is easy to set up and understand, and can link to any unit on patterns and algebra. In true Charles style, he shared that this game is similar to an old game called NIM. And something that he would do with his students is ask them to research Nim, and give one or two facts about it.
And with that, the session was soon over. Charles showed us the range of activities available on Maths300, and emphasised how the addition of open-ended and extended investigation tasks to students’ mathematical diets can build their working mathematically skills. Not only that, they are a lot of fun and offer space for rich discussions to take place in the classroom. I’m sold!
Session 2: BANSHO – Frances Lee
The next session I attended was about BANSHO, a Japanese organisational strategy for the classroom. I admit that it was not as relevant to me as a secondary teacher, but I will summarise the aspects of the presentation that I enjoyed and think could be useful to others. There are also plenty of resources out there for teachers interested in trying out this technique, particularly for middle years classes.
BANSHO refers to organising the board space in a way that facilitates student learning. Essentially, the board is a visual roadmap of students’ thoughts, and is a way of connecting student ideas to make sense of a problem.
The board is divided into roughly three sections to correspond to the three phases of a BANSHO lesson. The first is Activating prior knowledge. This is through an initial problem, posed potentially with an image to get students thinking. Underneath the image, the teacher adds keywords and other important vocabulary that students would need to know to think about and discuss the problem.
In phase 2, students are directed to explore the problem on their own, recording their thinking on paper. The teacher would monitor the work of the students, and mentally create a sequence of work samples to show to the class during discussion time. After students are given time to work on their own or in pairs, the teacher will ask the class to face the board. One at a time, students’ works are called up and added to the board. The teacher would have chosen the most concrete examples to go on the board first, and students would explain their thinking to the class. Following the concrete would be semi-concrete or more representational samples, then finally, the most abstract thoughts go last. As students come up to present their ideas, they make links to previous work as they go.
An example of phase 2: student work samples.
By this point, students should have a good sense of how a problem can be solved in multiple ways, and the journey to the most abstract solution is plain to see.
The final phase is Discuss and Extend, where the teacher would facilitate a discussion on how students’ different ideas are connected to each other. Afterwards, a new problem is given for students to apply their learning. This is summarised on the far end of the board.
In the workshop, Frances had prepared some examples of problems that she would map out on the board in the same way she would in her own classroom. If there wasn’t enough board space, she suggested having some butchers’ paper and blu-tack handy, or sticky notes for smaller representations. We went through the visual sequencing process together, and by the end of the session we knew how to select the more concrete examples first, before gradually progressing to the most abstract.
My reflective comments on the use of Bansho in a secondary context:
It may work well for a middle years classroom, i.e. year 7 and 8, where many students are still in a concrete phase of learning mathematics. A visual sequence for problem solving can help them move through the CRA (concrete representational abstract) stages in a more fruitful way.
An evident challenge for many teachers would be the time it would take to set up a Bansho lesson, and not necessarily knowing if it will pay off within the lesson period. I personally don’t mind experimenting with this later in my career and would be interested to see if there are any secondary teachers who use this strategy. A shift to Bansho would also mean a shift from quantity over quality, to quality over quantity.
In saying that, I wonder how well a Bansho lesson will stick in students’ minds after they have left maths and moved to other subjects over the rest of the day. I think it may work well for double period maths, so students have time to apply the ideas they learnt in even more contexts.
Bansho can easily be combined with some of the lesson ideas from Charles’ workshop, where a Maths300 activity becomes a springboard for a problem that is explored by students.
An advantage to Bansho is that it gives teachers the opportunity to see students’ thinking in Phase 2, and identify any misconceptions students may have. These misconceptions may resolve once the correct work samples are displayed by fellow students, and the teacher can also address them during the discuss and extend phase.
While I think Bansho is a solid strategy and a great way to structure lessons, I personally feel that the structure is too restrictive for me. I absolutely love the three-phase lesson (variations of which include Launch, Explore, Summarise), and I like the idea of getting students to move from concrete to abstract. However, I would definitely adapt certain elements, such as the presentation section – it may work well for primary students, but I don’t think high school students are as interested in others’ show and tell.
Overall, I thought the session was well worth attending to get an idea of how Bansho has been used in classrooms around the world, and there is a lot to appreciate about this strategy.
That’s the end of Part 1. In the next part, I cover literacy and numeracy, and further ideas for structuring lessons.
I started this blog at the beginning of 2020 for multiple reasons:
I wanted to bring together all sorts of resources and materials I had been engaging with in mathematics education
I enjoy discussing maths education but needed some written outlet so none of it would get lost
I wanted to chart my own development as a mathematics educator – how would my teaching philosophy and practices change over time?
At the time, I had no formal teaching experience. I was about to commence my Bali practicum (which I wrote about in my first published post), but everything I knew and read about teaching maths was purely theoretical. Since that time, a few things have changed. I have completed two professional teaching experiences (one in Bali, one domestically), and I tutor some students on a weekly basis. Safe to say my understandings of teaching maths has developed a lot over the past year.
The reasons I will try to continue this blog are the same as the reasons I started it. There is a lot out there for me to learn and I would like to document it all. I have discovered a lot of new things in my teaching experiences and I would like to share them all. So this post is a declaration of my commitment to honour the original aims of this blog.
This morning I took a look at some posts in my Drafts folder, many of which were generated while I was in Bali. I don’t know if I can complete those (sorry about Part 2) but I can try. In the meantime I will take a fresh direction. I won’t promise anything – it feels worse when a promise is unkept – but posts will generally feature lesson activities I’ve tried, book reviews/recaps, teaching ideas I have come across and would like to discuss, and more.
Halo! This pre-service teacher is completing her first professional experience in a rural fishing village in northern Bali as part of a university program. The school we are working with is a local junior high school, and we have been assigned year 7 and year 8 English (Bahasa Inggris), mathematics (matematika) and sustainability classes. Since this blog’s focus is on mathematics education, only the matematika classes will be recounted, unless I have the time to write more.
Our northern Bali school.
Teaching context
Here is some more information about how the teaching works when there is the obvious problem of a language barrier. There are three secondary teaching teams, each made up of 3-4 members and taking on one of three home classes in years 7 & 8. We teach students in English (and utilising whatever Indonesian we know), with local translators in the room who can help us relay instructions to the class, or assist pairs or groups of students with the work.
Translators are always on hand to pass on what you would like students to understand. However, this can be incredibly time-consuming if teacher talk takes up a majority of the lesson time; there would be a lot of back-and-forth. So how can lessons possibly be productive, efficient and educational when translation is needed?
We incorporate gestures, symbols, diagrams in our instruction and explanations. Our instructions are kept as simple and short as possible. [Note: important not to assume they know nothing – they are maths learners in their own language and don’t need to be belittled or underestimated] We repeat many key words to reinforce big ideas. We give students the chance to copy a demonstration if possible, to convey a certain concept. We give students the chance to try questions, and debrief as a class.
So these are some of the things pedagogical processes that went on in the first lesson. While I still need to develop many of these (they were only subtly applied during the lesson), I recognise they are tactics students respond well to and can learn content from.
The lesson
The three year 8 home classes did not have a maths teacher at all from the beginning of semester (which started in January). This meant that after quite a few weeks of unsupervised lessons, we would be stepping in to teach the first chapter of their textbook, which was on the Pythagoras Theorem (and properties of right-angle triangles). We sure made it their best maths lesson of the year!
Note: Since commencing this post, I have taught part of the lesson a second time to my teaching team’s home class, so this recount will merge both lessons where appropriate, with comments about how the second run differed from the first.
The lesson involved three segments, led first by our supervisor, then me, then a fellow maths major. The supervisor started with a quick revision of geometric properties and terminology by asking students to fill in a data table on the whiteboard (shown below). We also introduced the naming conventions for angles and sides on a shape (capital letters for angles, small letters for sides). English and Indonesian vocabulary were both valued in the classroom.
Revision table to open the lesson.
The following segment introduced the Pythagoras Theorem. Students were split into 8 groups of 4. Each group was given laminated grid paper, a whiteboard marker, three different coloured sheets of square paper, a ruler and a pair of scissors. Using the data projector, I displayed a grid on the whiteboard and modelled the drawing of a right-angle triangle along the grid lines. Each group drew their own right-angle triangle, which could be any size. The sides of the triangle were labelled with ‘a’, ‘b’ and ‘c’ (hypotenuse was ‘c’). From there, I asked groups to take one sheet of paper and cut out a square with the same side lengths as ‘a’. When they were finished, they would label this cut-out ‘Square A’. (In the original lesson, I had asked students to call this square ‘a’, but realised later that this could be confused with the name of the side.) They would continue this for sides ‘b’ and ‘c’ with a different colour for each. It was important that the shapes being cut out were actually squares, otherwise the next step would not have had the desired results.
Phase 1 of the activity. Materials needed: three s=different coloured sheets of paper, ruler, marker scissors and laminated grid paper.
Once students had finished, I challenged them to try to fit squares A and B into square C. Here is where a lot of consideration was required for how this activity would be presented, especially in the context of an Indonesian school. In the original lesson, I had initially pitched my instructions along the lines of: “I want you to find out something for me. Can the squares A and B fit in square C?” The supervisor intervened and made the instructions more explicit. “Using your scissors, try and overlap square C with squares A and B. For example, you could have square A in the top right corner, and cut square B into smaller pieces to fit around A. You could fit square A diagonally in square C so that all corners touched a different edge of square C, then cut square B into triangles to fit around A.” During this time, a lot of modelling was needed. Once students had an idea of what they were expected to do, we monitored the different groups to ensure they could find a solution. The intervention came because the question I had pitched to the class was rather inquiry-based. The supervisor brought up the different levels of classroom inquiry that can occur: directed, structured/guided and open inquiry… Perhaps even none. The school students we are working with have (generally speaking) only been exposed to teacher-centred approaches, with few opportunities for inquiry. My original question was on the other end of the inquiry spectrum to what students were used to. So at the very least, students would need a directed inquiry, with modelling and examples given.
Updated this post to add a suggestion from a colleague. If I wasn’t in a context where students were more open to inquiry-based learning, and instructions wouldn’t get lost in translation, this could be a good way to pitch the inquiry. “Looking at Square C, we know that it is bigger than square A and square B individual. Do you think that it could be bigger, or smaller than squares A and B combined? Prove your guess.”
All the groups in the end managed to complete the activity, with varying degrees of success. There were some groups that had unfilled gaps, resulting from the original squares not having correct proportions, or the smaller segments being cut up inaccurately. This seemed to happen in both lessons, and issues like this could cause misconceptions for the students. The questions is whether an activity like this is worth doing – despite these challenges, engagement was high and students could still make mathematical connections between what they were doing and the visual in their textbook.
In the original lesson, students were asked to walk around the room to look at the ways other groups fit squares A and B into square C. However, in the second version of this lesson, I got groups who had finished early to come up to the board and sketch out how squares A and B were cut up and overlapped square C. (Unfortunately no photo!)
After students had finished this, I did a bit of boardwork based on the triangle I drew on the grid. All of them had seen different ways of ‘covering’ square C. What is the area of square A? The length a x a, which is a squared. What is the area of square B? The length b x b, which is b squared. And the same for square C. What we found out through that activity was that: